


The world wants to know where it is economically headed in the near future and beyond.
This comprehensive article explores the shifting dynamics of global capital in 2026, drawing on the provided sources to outline why and where investment is moving.
Table of Contents
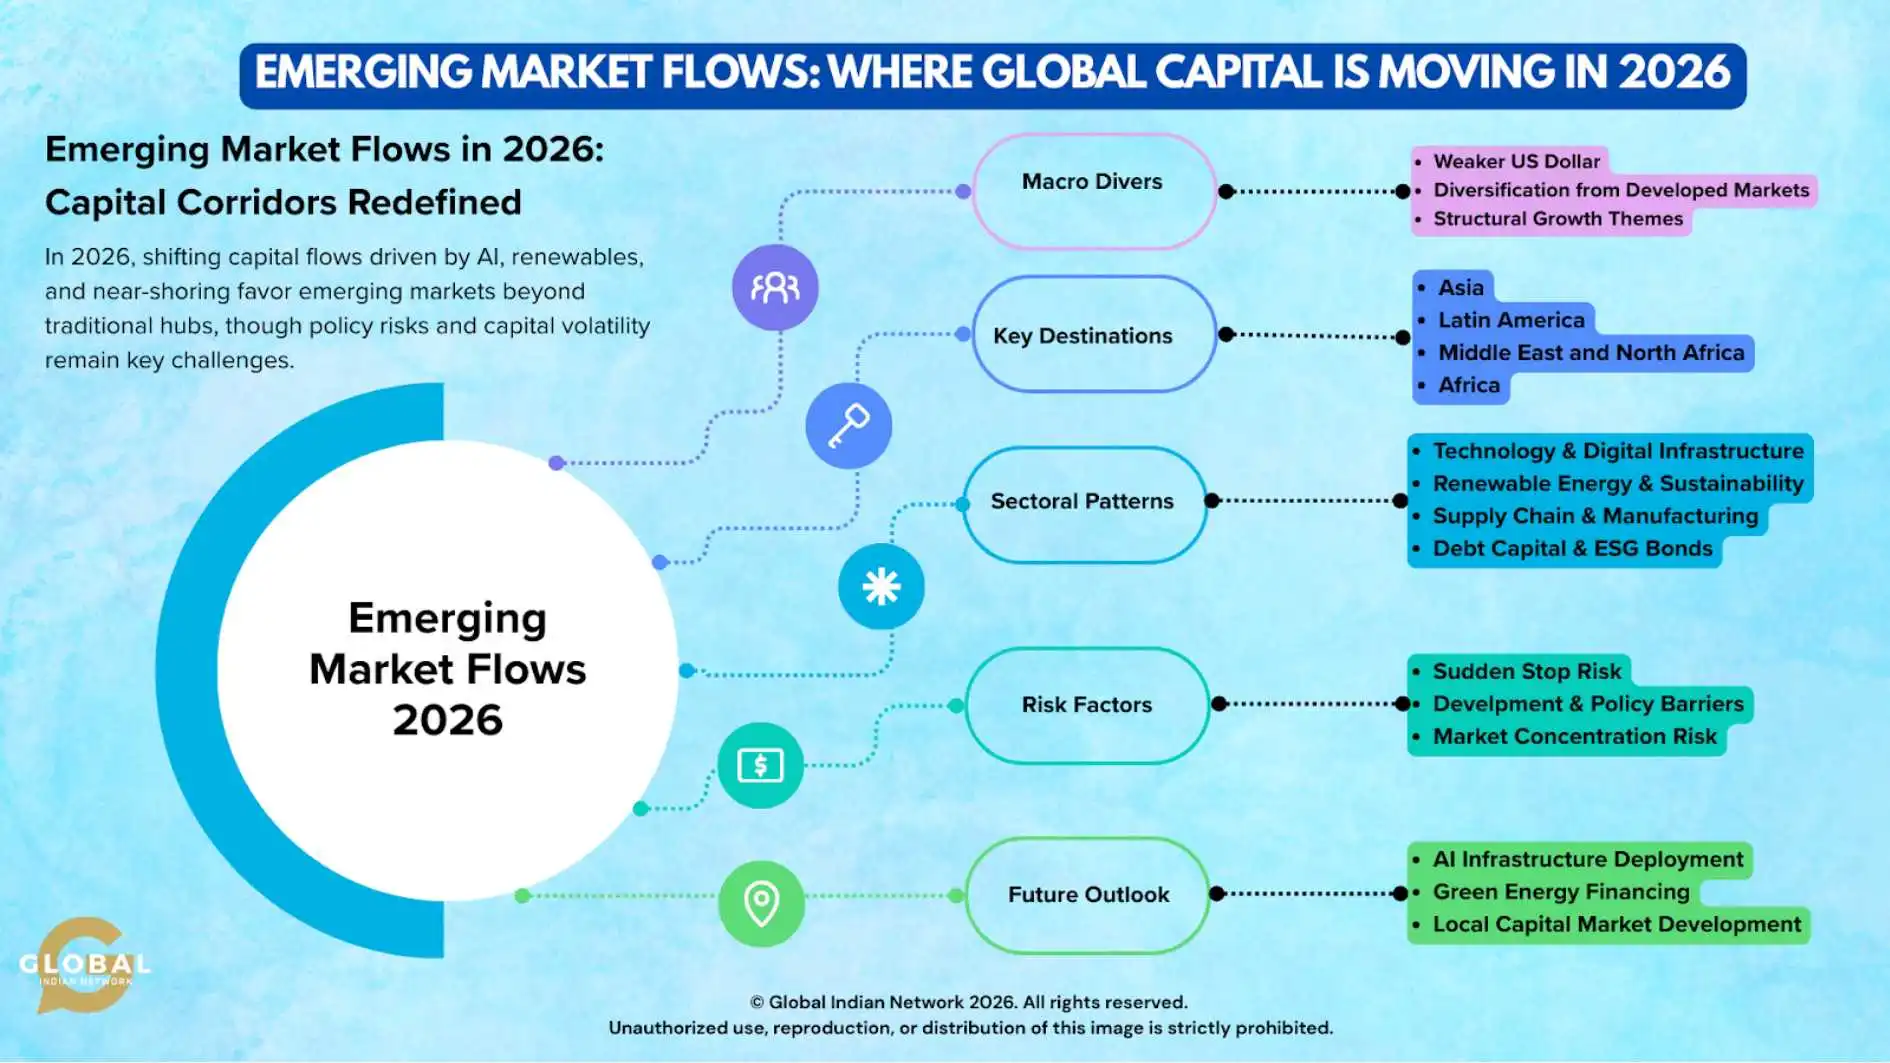
Emerging Market Flows in 2026: Capital Corridors Redefined
As 2026 unfolds, global capital flows are undergoing a profound transformation. A weakening U.S. dollar, diversification away from crowded developed markets, and structural themes like Artificial Intelligence (AI), renewable energy, and supply-chain realignment are driving investors toward new growth corridors. While traditional heavyweights like India continue to attract massive inflows, new winners are emerging in Southeast Asia, Latin America, and the Middle East. However, this “landscape in transition” is not without its hurdles, as investors must navigate risks ranging from policy barriers to “sudden stop” capital outflows.
UNCTAD forecasts global growth at 2.6%.
Macro Drivers: Why Capital Is Moving
A Softer Dollar and Renewed Risk Appetite: A primary tailwind for emerging markets (EM) in 2026 is the weakening U.S. dollar. A softer dollar is a dual benefit: it enhances returns for foreign investors and reduces the cost of servicing debt held in local EM currencies. This shift has bolstered investor sentiment, leading to accelerated inflows into EM equities and fixed income.
Diversification Beyond Developed Markets: Persistently high interest rates and rising valuations in the U.S. and Western Europe have pushed global portfolios to seek alternatives. Institutional shifts are becoming evident as EM exchange-traded funds (ETFs) record strong inflows, particularly from European investors signaling a pivot away from developed market dependence. Analysts project that overall EM GDP growth will sit around 4%, providing a stable backdrop for this transition.
Despite the surge in specific corridors, FDI into emerging market and developing economies (EMDEs) has contracted to 2% of GDP in some areas and remains below historical peaks.
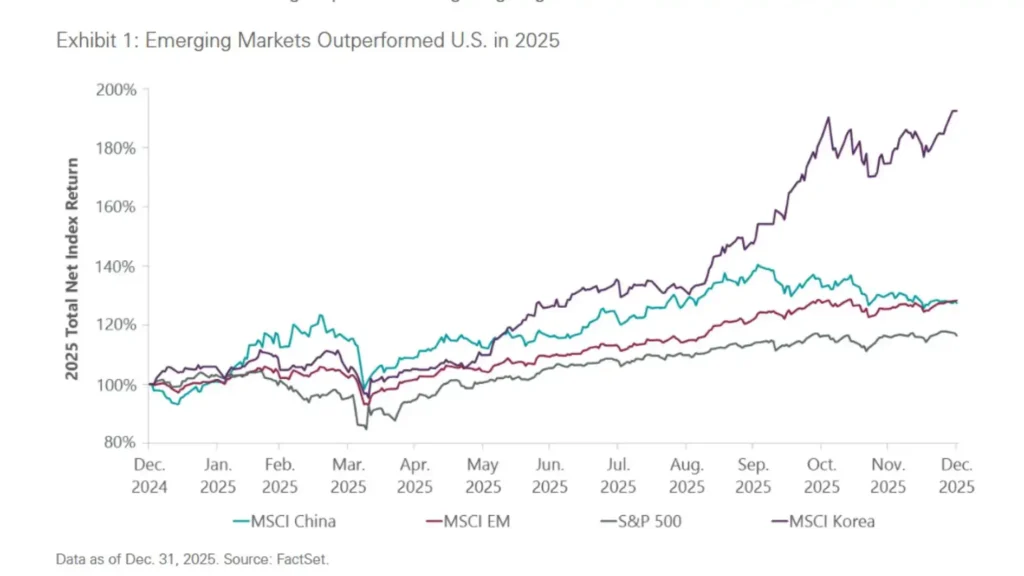
For the first time since 2017, emerging stocks are outperforming US peers… This year’s capital rush into the sector – the best since 2009 – signals a multi-year cycle of investment inflows.”
— Bloomberg Markets, Dec 21, 2025
Regional Winners: The New Investment Map
Asia: The Powerhouses of India and Vietnam
- India: Now ranked alongside major developed economies in CEO surveys, India is one of the year’s hottest investment destinations. Capital is pouring into financial services, technology, and infrastructure, with analysts forecasting double-digit returns for Indian equities. Analysts broadly expect Indian equities to deliver double-digit returns into 2026, with CLSA forecasting ~16% upside, market strategists highlighting earnings-led gains, and a majority of professionals anticipating India to outperform global peers.
- Vietnam: A critical milestone is expected later in 2026 as FTSE Russell upgrades Vietnam’s stock market from frontier to emerging market status. This move is predicted to unlock several billion dollars in both passive and active investment.
- ASEAN Bloc: Beyond the leaders, Indonesia, Thailand, and Malaysia are seeing marked increases in cross-border investment, even as China faces a modest slowdown in foreign direct investment (FDI).
Latin America: Commodities and Near-Shoring
The region is gaining traction due to the global electrification trend.
- Brazil, Chile, and Peru: These markets are attracting capital into the copper and lithium sectors, which are vital to green energy.
- Mexico: As a prime beneficiary of “near-shoring,” Mexico is leveraging its trade links with the U.S. to attract billions in manufacturing FDI.
| Region | 2026 Inflow Projection | Key Driver |
| India & ASEAN | +15-20% increase | Supply chain diversification & tech |
| Africa & MENA | +10% increase | Infrastructure & energy projects |
| Latin America | Moderate growth | Commodity demand (electrification) |
Middle East & North Africa (MENA): Beyond Hydrocarbons
The Gulf region—led by the UAE and Saudi Arabia—is aggressively diversifying its economy. Global capital is being directed toward AI infrastructure, data centers, and sustainability projects. Meanwhile, countries like Egypt and Jordan are emerging as higher-risk, higher-reward destinations, often supported by Gulf institutional capital. Emerging market economies are expected to deliver approximately 4% GDP growth in 2026.
Africa: Infrastructure and Project-Based Growth
Africa’s inflows are surging, driven by massive energy and infrastructure projects. Egypt remains a key magnet, but there is also a “mineral race” occurring across the continent as global powers secure supply chains. Sovereign wealth funds and pension assets within the region are increasingly providing a local buffer against external financing gaps.

Sectoral Patterns: The Structural Anchors
Capital is no longer just moving toward countries; it is following specific structural themes:
- AI and Digital Infrastructure: Tech spending—ranging from cloud services to cybersecurity—is luring investment across the Gulf and other EMs as digital ecosystems become central to economic competitiveness.
- Renewable Energy: Countries like India are rapidly expanding renewable capacity, creating fertile ground for long-term investment in solar, wind, and green hydrogen.
- Supply Chain Realignment: Geopolitical fragmentation has accelerated “friend-shoring.” Investors are betting on EMs that provide the logistics and manufacturing capacity to replace traditional hubs, with Mexico and Vietnam leading this shift.
- Debt and ESG Bonds: High yields and attractive local-currency returns are bringing investors back to EM sovereign and corporate bonds. There is a notable rise in green and sustainable bond issuance, particularly from Chile and India.
Assessing the Risks
While the outlook is generally optimistic, the sources highlight significant fragilities:
- Sudden Stop Risk: If U.S. policy unexpectedly tightens relative to other markets, it could trigger sharp capital outflows from EMs.
- Development and Policy Barriers: In the poorest EMs, FDI remains below historical peaks due to trade barriers, weak institutions, and regulatory uncertainty.
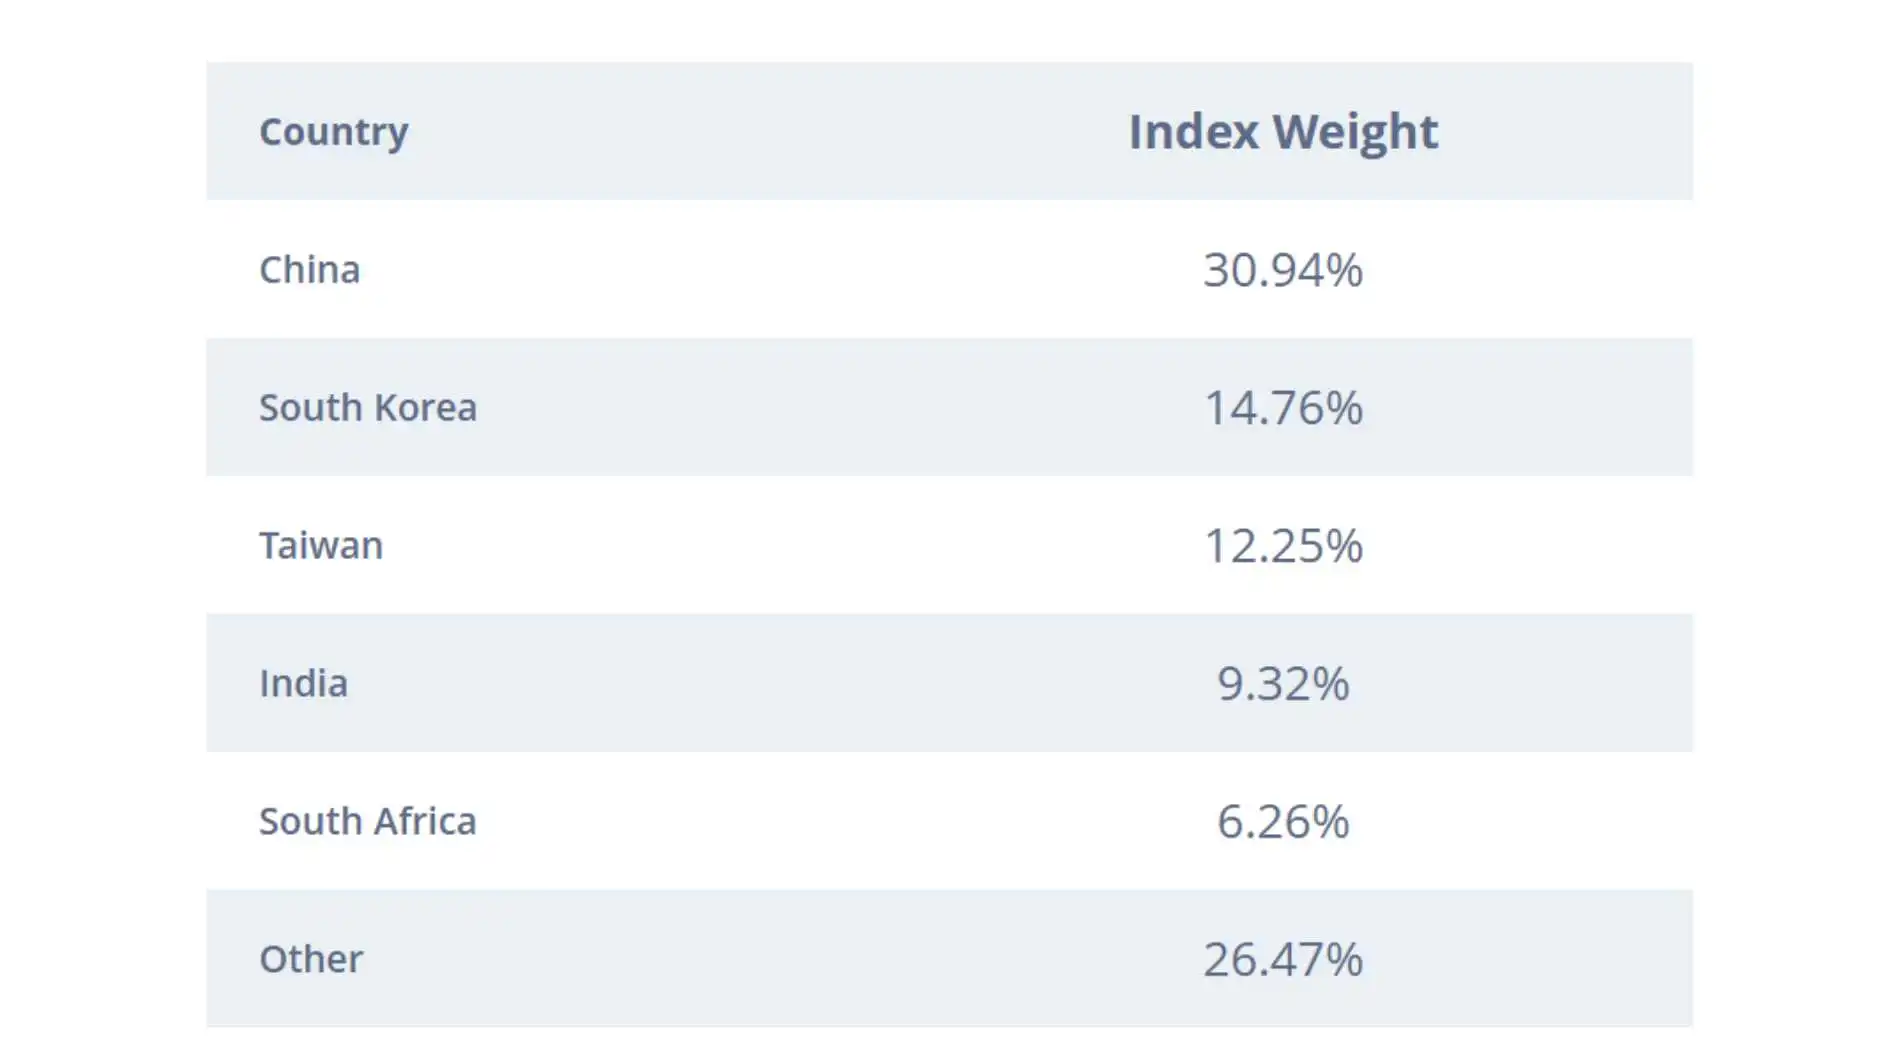
- Concentration Risk: A handful of markets—China, India, Brazil, and the Gulf—absorb the bulk of foreign investment, leaving smaller emerging economies at risk of capital scarcity.
Visual Resource Guide: Adding Depth
These graphs and charts validate the metrics behind inflows, outflows, and other economy-related parameters.
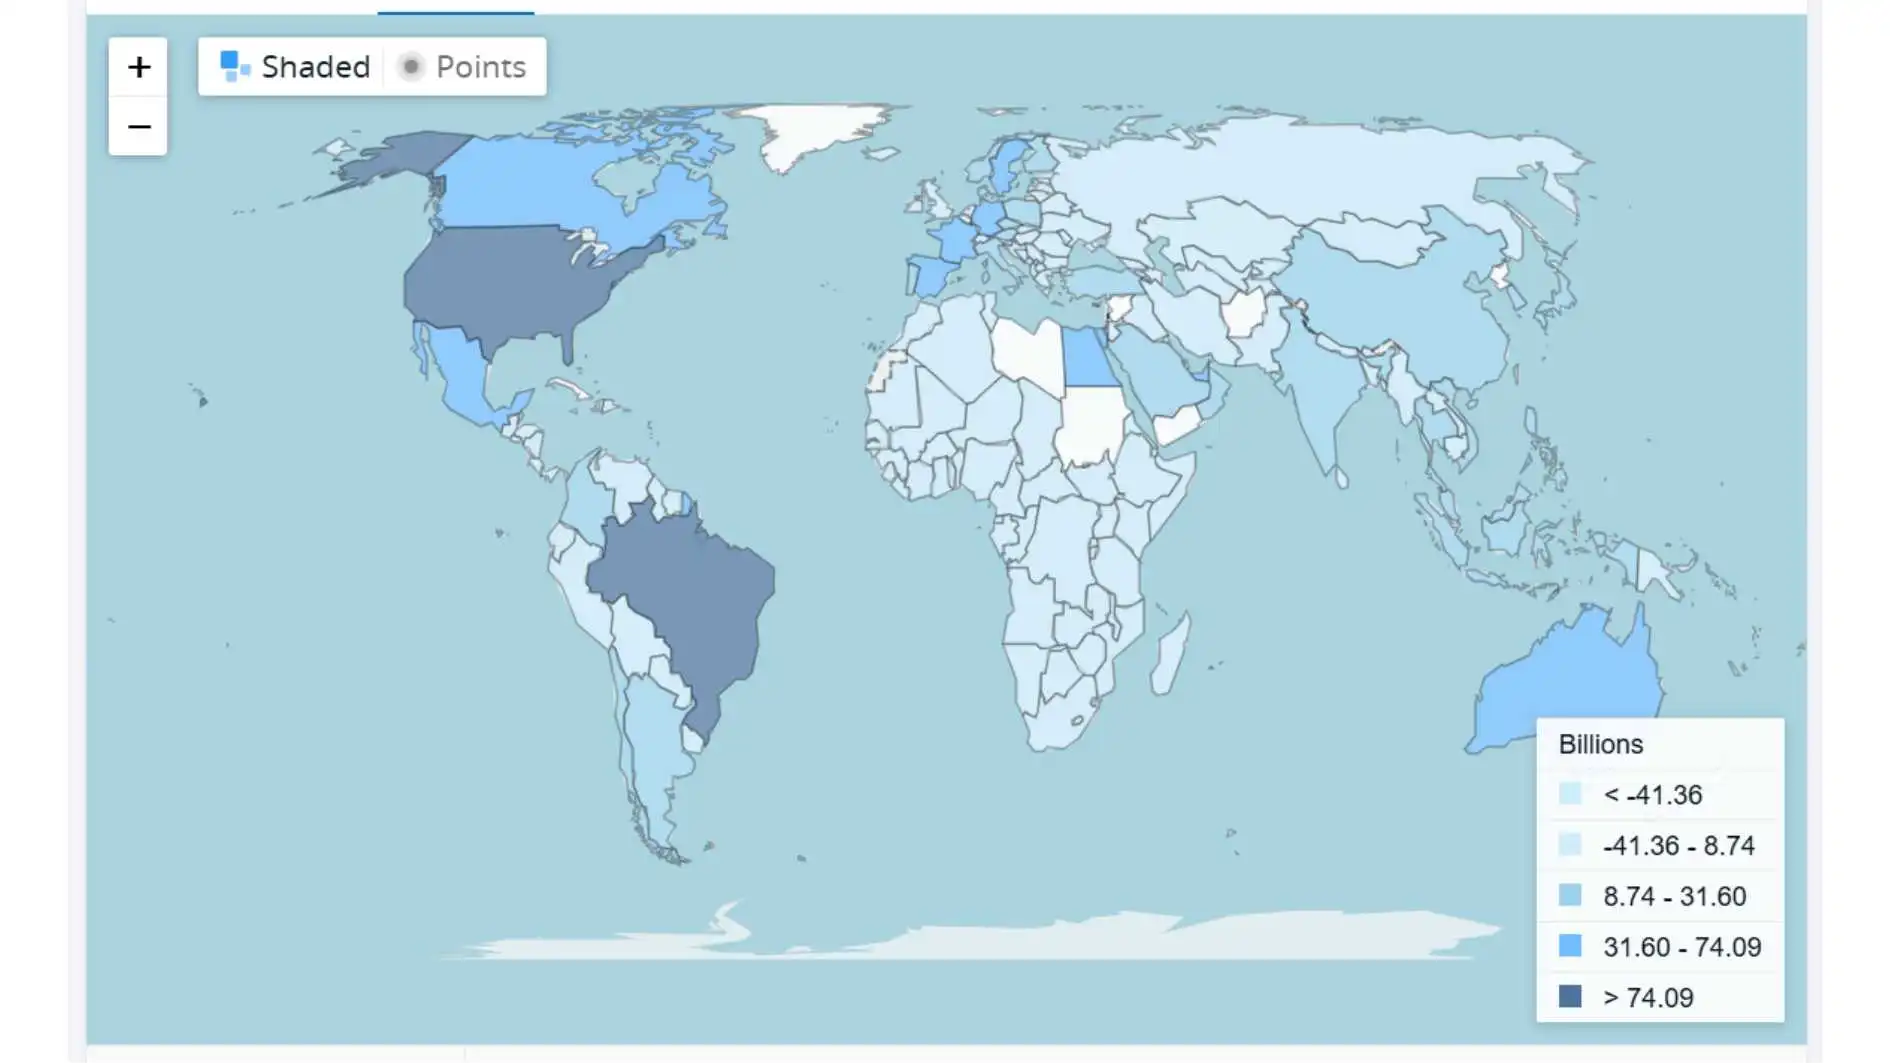
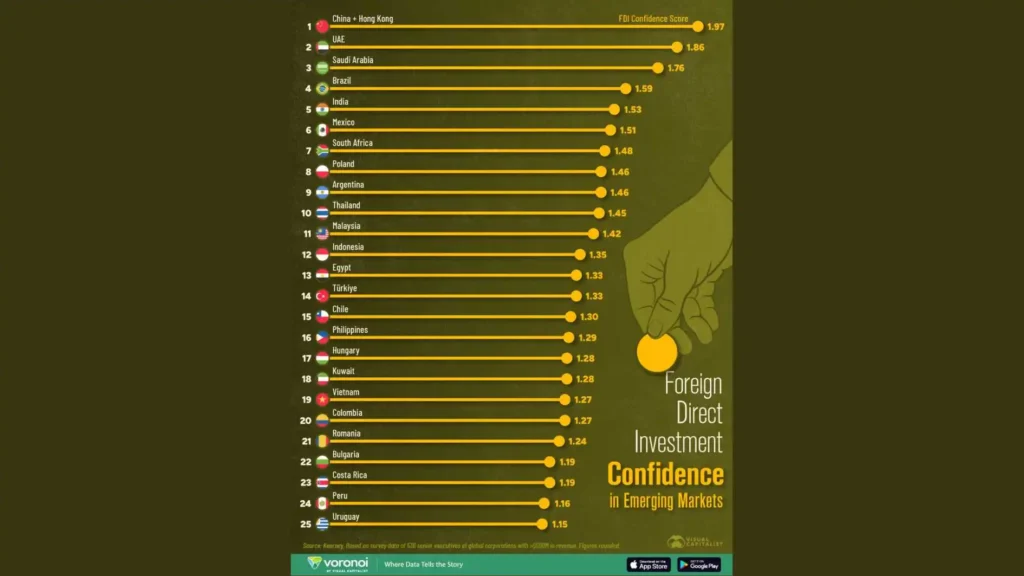
| Theme | Source |
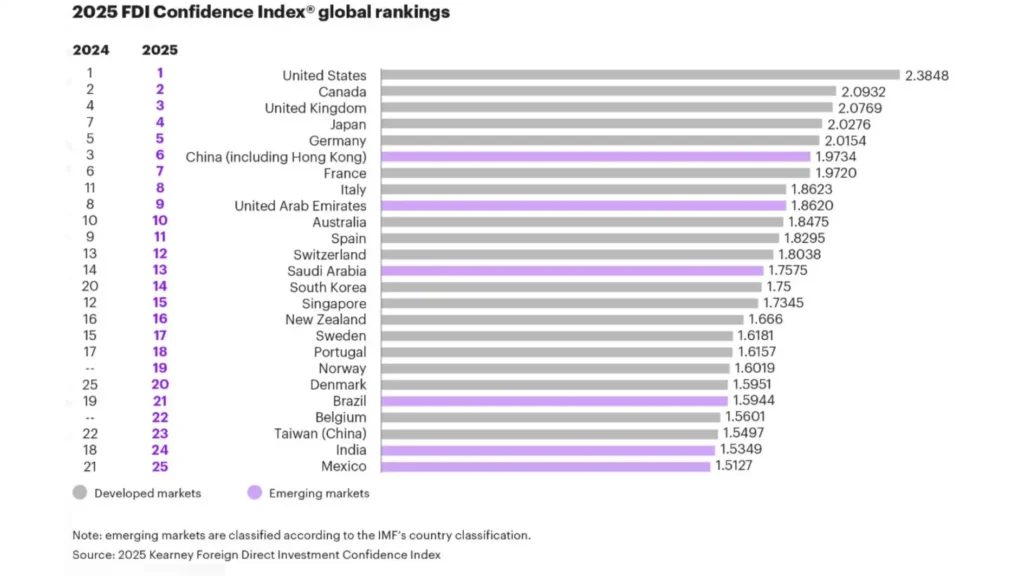
| FDI Confidence | Global EM FDI confidence scores and rankings |
| Equity Performance | MSCI EM Index vs. S&P 500 performance |
| Market Upgrades | FTSE Russell classification transition chart |
| Commodity Demand | Projections for Copper & Lithium through 2030 |
| Sustainable Finance | Growth of EM green and sustainable bond issuance |
| Supply Chain Shifts | Near-shoring FDI flow volumes to Mexico/Vietnam |
Why Mexico and Vietnam (and Not Others)?
While other emerging markets such as India, Indonesia, and Eastern Europe also benefit from supply-chain diversification, Mexico and Vietnam offer the clearest, most data-driven examples of manufacturing-led FDI reallocation in the current cycle.
They Represent the Two Dominant Near-Shoring Models
Mexico and Vietnam are not random choices, they anchor two different but complementary supply-chain shifts:
| Model | Country | Why it matters |
| Near-shoring (proximity) | Mexico | Direct access to the U.S. market via USMCA |
| Friend-shoring / China+1 | Vietnam | Low-cost manufacturing + trade diversification |
Together, they define the global playbook for supply-chain realignment.
They Consistently Rank At the Top of FDI Beneficiary Lists
Across UNCTAD, World Bank, IMF, and corporate surveys:
- Mexico and Vietnam are top-tier FDI recipients tied to:
- Manufacturing relocation
- Export-led growth
- Multinational de-risking from China
- Manufacturing relocation
- They are outcomes, not predictions.
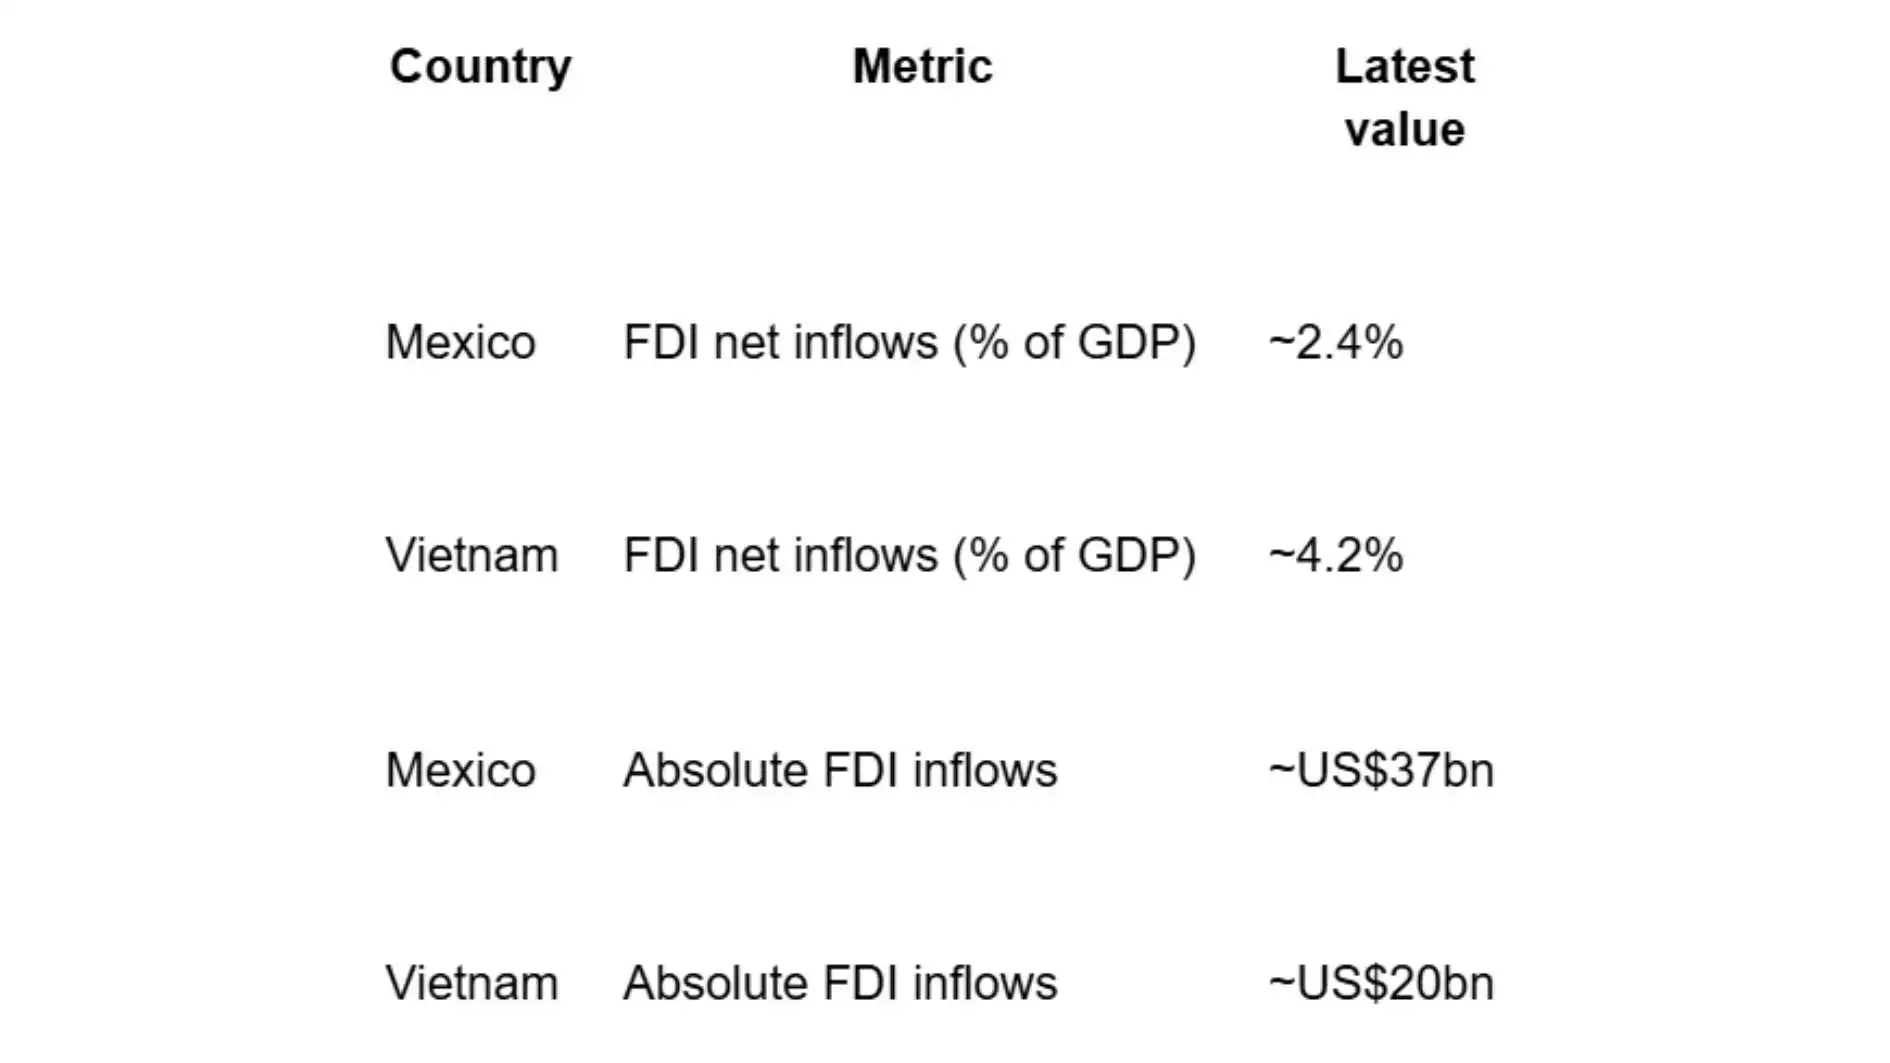
They Show a Powerful Contrast: Scale vs Efficiency
This is analytically valuable:
- Mexico
- Large absolute FDI volumes
- Deep industrial base
- Higher wages, higher capital intensity
- Large absolute FDI volumes
- Vietnam
- Smaller absolute flows
- Much higher FDI as % of GDP
- Lean, export-driven manufacturing
- Smaller absolute flows
This contrast highlights how capital allocation responds differently to geography, cost structures, and market access.
Clear Case Studies with Minimal Analytical Distortion
Unlike some peers:
- India: Massive market, but FDI mixes services, tech, infra, M&A
- Indonesia: Resource-heavy; FDI often commodity-linked
- Brazil: Cyclical, commodity-driven FDI
- Eastern Europe: Distorted by geopolitics/war risk
Mexico and Vietnam give you:
- Manufacturing-led FDI
- Export-oriented investment
- Clear causality to supply-chain shifts
That makes them ideal examples, not exhaustive lists.
They are Already Referenced by Global Decision-Makers
CEOs, policymakers, and investors expect Mexico and Vietnam to appear in any serious near-shoring analysis.
Given their central role in global supply-chain realignment, any analysis of near-shoring and friend-shoring would be incomplete without reference to Mexico and Vietnam.
Outlook and Investor Takeaways
As we move through 2026, the MSCI Emerging Markets Index performance suggests sustained interest as diversification narratives strengthen. However, capital flows may moderate from the record highs of 2025 as investors balance optimism with caution regarding geopolitical tensions.
Key Takeaways for 2026:
- Monitor Vietnam: The status upgrade is a structural milestone for Southeast Asian finance.
- Watch the Gulf: The transition into a digital and AI hub is moving faster than many anticipated.
- Electrification is Key: Latin America’s lithium and copper supply chains are critical for global portfolios.
- Diversify Strategically: While India and Brazil are safe havens, the concentration of capital means investors must look for overlooked niches to avoid crowded trades.
Conclusion
Global capital flows into emerging markets are increasingly targeted, thematic, and concentrated. Investors are moving away from broad EM allocations and instead favour countries that combine economic scale, policy credibility, and strategic relevance within global supply chains. Near-shoring dynamics are channelling investment toward Mexico and Vietnam, while the global push toward electrification is driving capital into Latin America’s copper- and lithium-rich economies.
India and the Gulf are emerging as key destinations for long-term investments in digital infrastructure and “digital sovereignty,” including cloud services and cybersecurity. At the same time, green and sustainable finance has become a distinct capital channel, with issuance led by a small group of credible emerging-market issuers such as Chile and India. This growing concentration means that while large EMs continue to attract substantial inflows, smaller markets face heightened risks of capital scarcity – reinforcing the need for precision, not breadth, in emerging-market investment strategies heading into 2026.
We at the Global Indian Network will be covering this topic on an ongoing basis. Be with us and get ahead of the curve.